Overview
I developed an R workflow for single-cell RNA-seq analysis, from quality control and cell-type annotation to composition analysis and microglial subclustering. One example run applies the workflow to control and LPS-exposed mouse brains.
Approach
- Preprocess the data and assess quality by sample and condition.
- Identify cell clusters and check annotations against marker expression.
- Compare cell-type proportions across samples and conditions.
- Analyze microglial subpopulations in greater detail.
Cell-type annotation
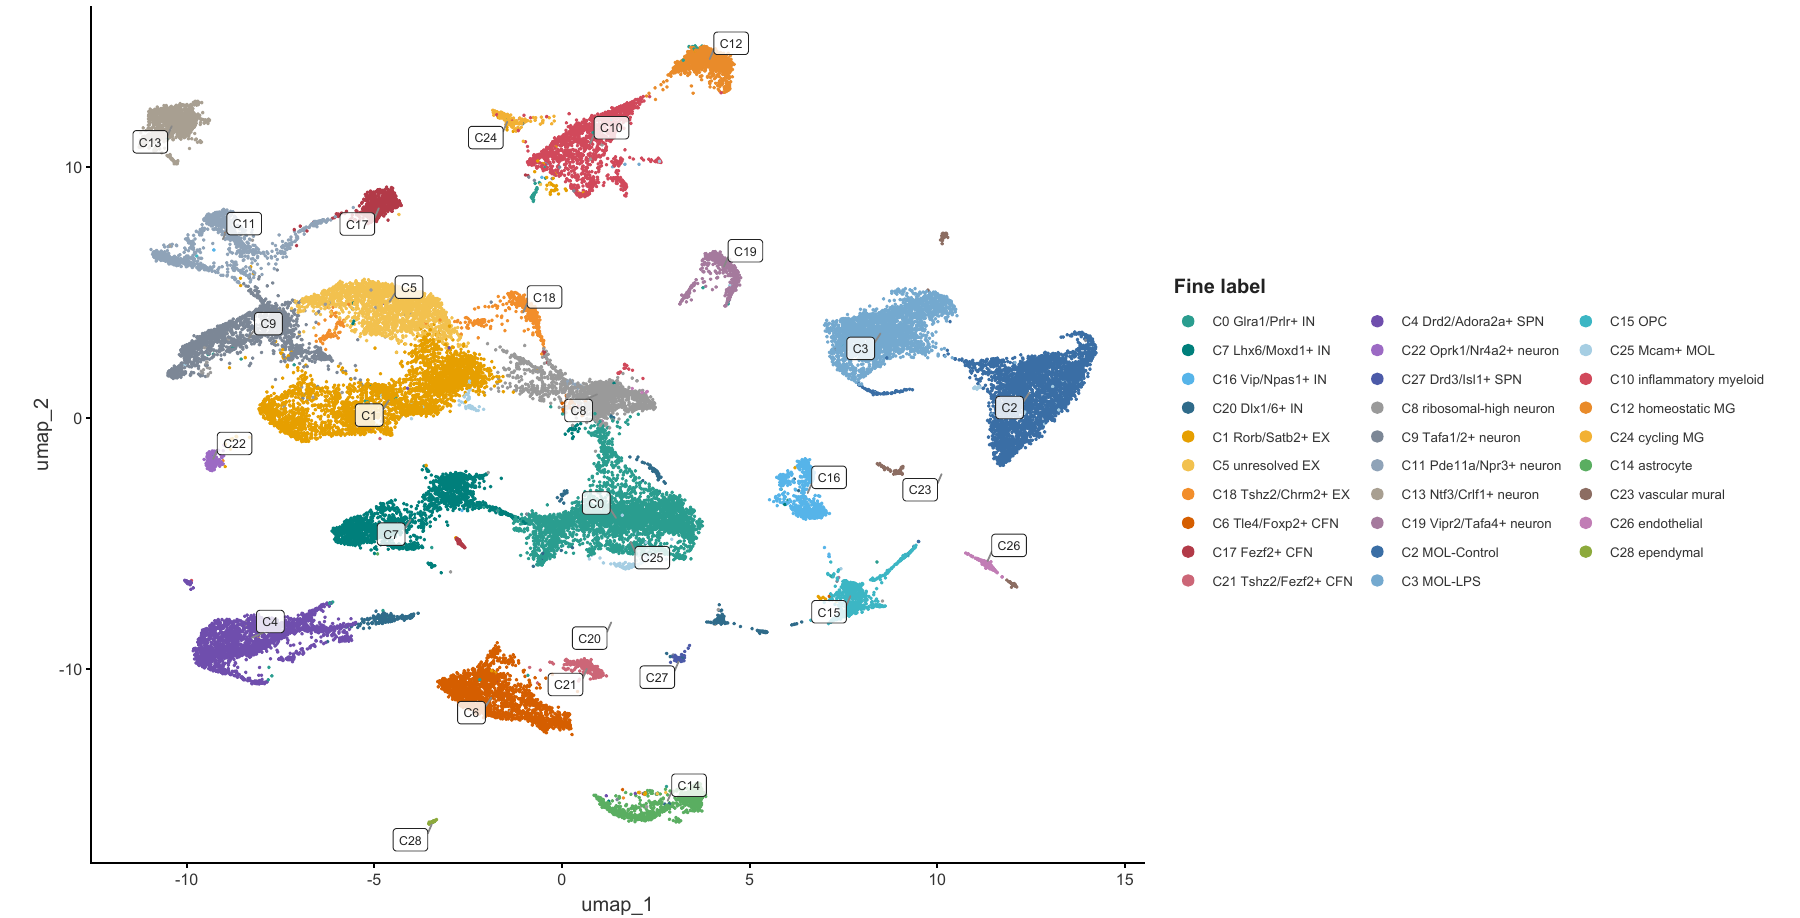
After quality control and preprocessing in Seurat, I used PCA and clustering to identify groups of cells. I checked cell-type annotations against marker-gene expression and compared cell-type proportions across samples and conditions.
Microglial analysis
I then analyzed the microglia separately, repeating normalization and clustering within this population. The analysis recorded cell counts by sample and explored candidate damage-response states.
Recorded outputs
The R scripts, processed objects, figures and logs record each stage of the analysis.
- Quality control: sample- and condition-level violin plots and QC scatter plots.
- Cell atlas: PCA and UMAP views, cluster views, and refined cell-type annotation.
- Annotation checks: marker dot plots by cluster and cell type.
- Composition: cell-type proportions shown by sample and condition.